Cleveland Family Study
12.13 Score Rhinometry Curves and Print Reports
12.13.1 The Rhinometry Printout
Unlike the pharyngometry printouts, the rhinometry printout does not need to be prepared for analysis prior to incorporation into the existing database.
Test Quality is judged by the following criteria:
- Reproducibility
- Lack of “noise”
- Appropriate testing technique
- Readability of test
12.13.1.1 Figure 1: Digital Screen of Rhinometry Testing Program
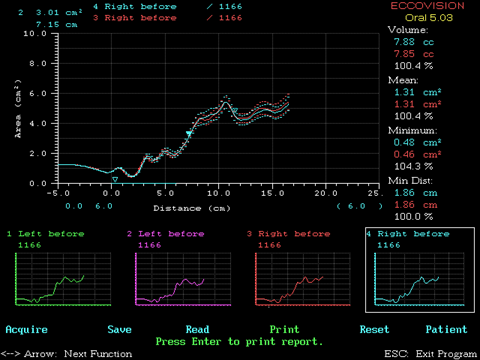
This graphic represents the digital screen of the Rhinometry testing program. This graphic reveals the following:
- This is the before steroid test; thus, the screens are labeled “BEFORE” (The post test will look markedly similar)
- Test #4, featured on the graphic, is a bit noisy—this is indicated by the dots around the line (scatter) this is due to an inconsistent seal on the nostril by the tester
- Otherwise, all the tests are acceptably consistent
12.13.2 Scoring Procedure
- Run the oral_scoring.bat batch file.
- Select the appropriate option based on which data you wish to process (1. Family Rhinometry)
- The program will remove all files currently in the Oral File Directory folder and will copy files from the appropriate study directory to Oral File folder.
- In the ORAL 5.03 scoring program, hit F6 to view patient list. If RhinoCheck.sas was not run or did not run successfully, the userfile will not be valid and there will be no studies to view.
- Select the participant file of interest. There will be two files identically named. This is because of the pre- and post- nasal steroid tests. Do one at a time.
- Press Enter.
- Enter analysis segments as 0.00 to 6.00 and assign curve scores according to the following:
- If at least one of the two graphs goes off the chart in the analysis segment, score as 2.
- If not scored as 2, then if the two graphs have wide variation (not replicated) in the analysis segment, score as 3.
- If not scored as 2 or 3, then if at least one of the two graphs goes off the chart after the analysis segment, score as 4.
- If not scored as 2, 3 or 4, then if identified by the SAS program as an outlier, score as 5.
- If not scored as 2, 3, 4 or 5 and the graphs look good, score as 1.
- Only if necessary: press F5 to adjust segment length. These are the last two categories at the end of the page. Type in appropriate length.
- Print Rhinometry curves.
- Press F6 to view the other file.
- Press Enter.
- Repeat Steps 7 – 9
- Press Esc to exit ORAL 5.03.