Hi NSRR team,
I am working with the SHHS1 dataset and I ran into inconsistency between my analysis results and some of your reported variables in the 'shhs1-dataset-0.14.0' form, in particularly with the 'supinep' and 'slpprdp' variables. I'll be thankful if we could figure it out together.
As part of my analysis I am deriving the TST and the total sleep time in supine position of each patients and as sanity check I compared my results with yours. Most of the time, our results are consistent (even identical) in both parameters, however, there are still few mismatches.
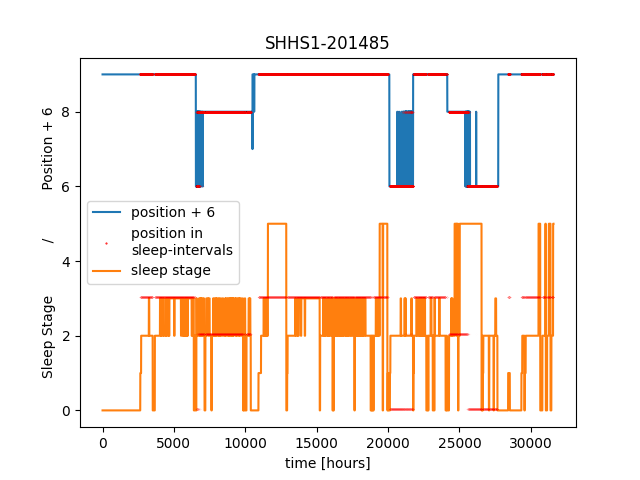
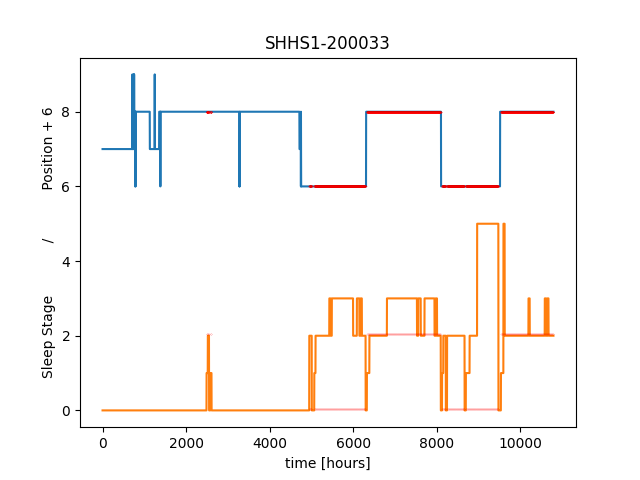
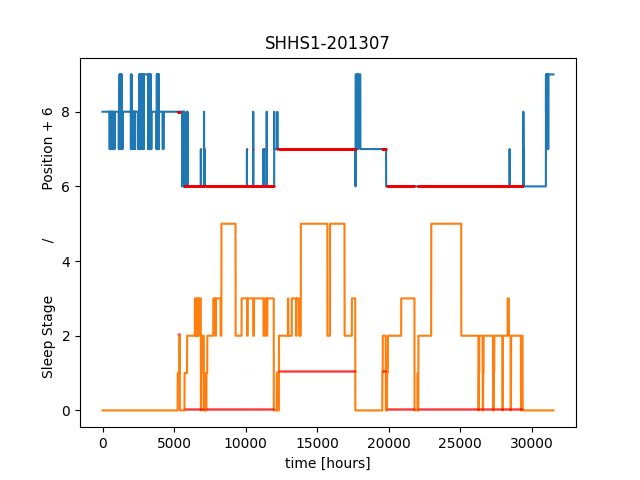
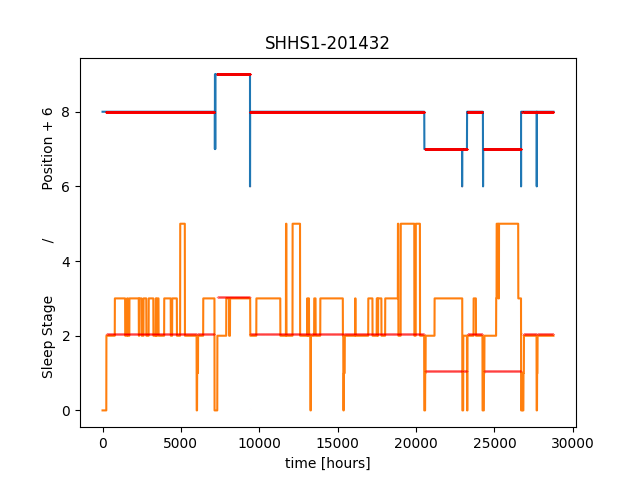
In order to understand the gap, I plotted the position-during-sleep over the whole-position-raw-signal and and over the sleep-stages to verify that it is indeed in the sleeping periods. (In order to make the graph clearer, I added +6 to the position signal to separate between the sleep stages signal and the position signal). The figures are attached below.
- Notice that position=8 is the supine position (2+6) and that sleep stages=0 is 'awake'.
Some cases for instance (all are in hours)-
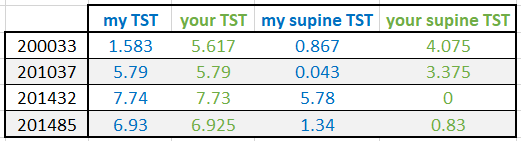
I'll be glad to hear your opinion on the differences and willing to send you all the cases where my results are dissimilar to yours.
Please let me know if something isn't clear enough,
Yuval Ben Sason,
AIMLab., Technion.
By the way, could you quantify a "few mismatches" across the 5,804 SHHS1 studies? You said they were sometimes identical, but I'm guessing there are many that are very close to one another but not quite exact. I have seen that sort of pattern (close but not exact) when doing similar explorations of the data in the past.
Maybe you could derive how many subjects have differences of > 5 minutes?
Yuval,
Unfortunately I don't have any grand explanations to report. My colleague looked at the source data from some of your examples and the supine TST appeared to match your findings (i.e. differed from the CSV dataset as well). I would go with your findings in this case since that is what the raw signal is telling you.
It's hard to explain things in SHHS because the data were exported from versions of the scoring software more than 20 years ago. That software no longer works and we have backwards compatibility issues when we try to open these data from these 1990s in modern software to try and sort out how these issues occurred. Clearly some "bad" data have made their way into the CSV/results dataset.
Sorry I couldn't be of more help. Thank you for being diligent in your review of the data and good luck with the analysis!
Mike