We use cookies and other tools to enhance your experience on our website and to analyze our web traffic.
For more information about these cookies and the data collected, please refer to our Privacy Policy.

shaunpurcell

shaunpurcell
Joined May 2014
shaunpurcell
Joined May 2014

A good but also generally applicable question, and there isn't really a single answer. IMO, as far as any physiological measurement goes, there probably aren't grounds for expecting PSG data to be exceptionally difficult in this regard - e.g. perhaps versus more experimental/task-based paradigms, although of course the devil is in the details. If pushed, I'd say that most times -- let's say 80% -- metrics will be broadly comparable across cohorts, such that cohorts can be (statistically) combined in analysis. Still, that leaves a non-trivial chance of issues arising (depending on the particular datasets and analyses) that could bite you...

A few general off-the-top-of-the-head thoughts and approximations to best practice (here thinking primarily about the sleep EEG, which I admit might be more directly comparable than some other channels, e.g. position sensors).

In favour of combining:

  • if 'cohort' can be included as a covariate in subsequent analyses, one is probably less worried about exact scale dependencies / systematic biases driven by cohort-specific factors

  • note that there can often be equally pervasive differences within individual cohorts, which are often multi-site studies themselves, i.e. probably all analyses should be approached with a similarly skeptical mindset, whether cross-cohort or not

  • FWIW, in our own work w/ NSRR cohorts, we've been able to perform multi-cohort analyses (from NSRR) that have shown broadly comparable results across cohorts. e.g. https://pubmed.ncbi.nlm.nih.gov/33199858/ https://pubmed.ncbi.nlm.nih.gov/28649997/ https://www.eneuro.org/content/9/5/ENEURO.0094-22.2022

  • should the prospects for potential bias necessarily preclude any analysis? Probably not, if one can also find other triangulating approaches (e.g. replication in different datasets, using different assumptions, etc) and appropriately report caveats, etc

Could go either way:

  • some cohorts will be more similar than others - e.g. MrOS and SOF had similar protocols and hardware I believe (and investigators) and so will presumably be intrinsically better matched

  • some metrics may be more likely to be more susceptible to cross-cohort effects, although hard to make general rules about this as it typically entails an "all other things being equal" assumption

  • the issue is certainly not related to Luna-derived parameters (nor NSRR datasets, for that matter). For example, sleep duration estimates based on manual staging can often show differences between cohorts that aren't obviously driven by demographic or clinical factors... same principles as above apply to approaches to analysis, i.e. sensitivity analysis, replication, orthogonal methodological approaches, etc.

Against:

  • direct comparisons between cohorts are expected to be biased. Even in the MrOS/SOF context, comparing those two cohorts directly as a proxy for sex differences (i.e. MrOS is a male cohort, SOF is a female cohort) is likely to be biased, i.e. as any artifact is completely correlated with the exposure of interest, etc.

  • cohorts are often likely to differ in (subtle or not so subtle) substantive ways due to ascertainment criteria, etc, as well as any technical factors due to PSGs / pre-processing, etc, making it difficult to determine in even principle whether two cohorts are completely comparable or not, if one doesn't even expect equivalent values for a given metric (conditional on some set of baseline, e.g. demographic, covariates)

Cheers, --Shaun

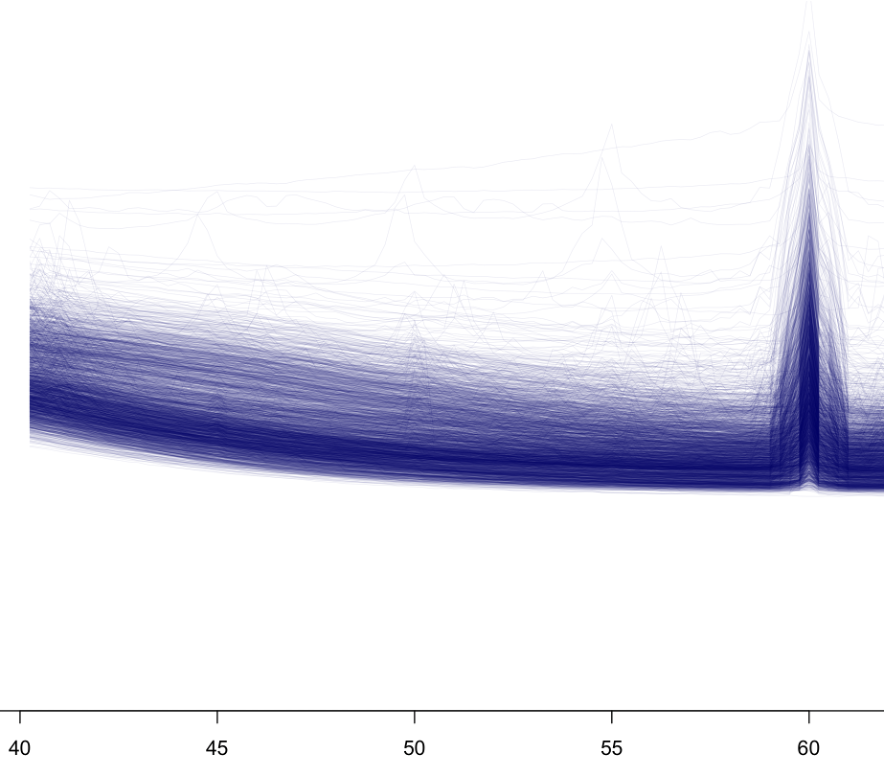
Hi -- I wasn't involved w/ the SHHS data collection, so I can't really speak to the hardware specifics, recording set-ups, etc, with any authority. However, taking a cursory look at the SHHS EEG power spectra, I can comment that the predominant peak is at 60 Hz (i.e. as expected for mains hum in the US), not 50 Hz. i.e. here are all spectra for C4-M1 from ~2500 individuals in SHHS2 super-imposed:

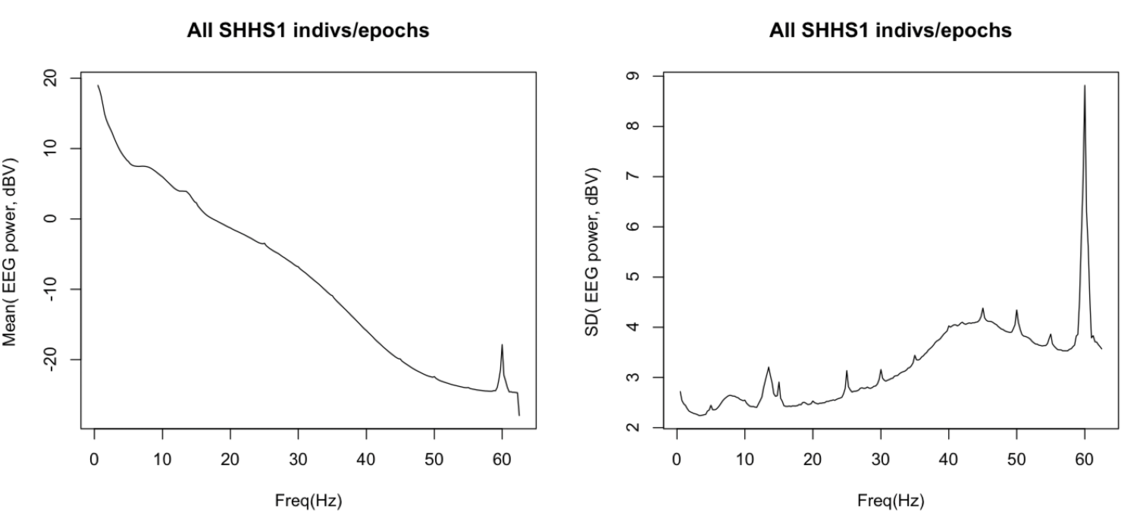
Certainly, on closer inspection some individuals will inevitably exhibit other forms of artifact, but 50 Hz line noise doesn't appear to be a primary form for this channel. For example, looking at the mean power from n~5000 individuals SHHS1 for the same channel - here plotting the mean doesn't show any marked sample-level peak at 50 Hz (perhaps a tiny blip...), but it does show a clear peak at 60 Hz (left panel).

If one instead looks at the standard deviation of power across individuals (rather than the mean), there is some suggestion of increased inter-individuals differences in 50 Hz power, suggesting that a subset of individuals may show excess 50 Hz noise -- but (as expected) the variability in 60 Hz power is much greater; there are also other frequencies in the raw, un-QC'ed signal showing similar things, e.g. subharmonics at 25, 30, 55 Hz, etc). Presumably in some recordings there were other electrical devices operating at these frequencies/harmonics of.... I don't imagine that resolving exactly what those sources would be feasible/necessary. In any case, the main point is that we seem to see the expected 60 Hz noise, not 50 Hz. Let us know if you have other specific analyses that point to 50 Hz noise as predominant.

Cheers, --Shaun

These are 'as is' data - we plan to post 'harmonized' versions of this (and all) NSRR datasets soon, with consistent (and Luna-friendly) formatting. In the mean time, given access to the command line, you can make .annot files with a one-liner script. Luna's .annot format (described here: https://zzz.bwh.harvard.edu/luna/ref/annotations/#annot-files ) is designed to be ~easy to convert to from other formats. To make a 3-column .annot file: a) remove header rows, b) order columns label, start, duration, with duration starting to "+" to indicate it is not elapsed seconds from EDF start, and c) a small tweak, but swap out colons in labels (a special character fro class/instance label distinctions) to something else: e.g. something like:

 awk -F"\t" ' NR != 1 { print $3 , $1 , "+"$2 } ' OFS="\t" 10012_22912.tsv | tr ':' '_' > 10012_22912.annot 

Luna then reads it:

$ luna 10012_22912.edf annot-file=10012_22912.annot -s DESC

+++ luna | v0.28.0, 10-Apr-2023 | starting 09-May-2023 12:41:10 +++

input(s): 10012_22912.edf output : . commands: c1 DESC
edffile [10012_22912.edf]


Processing: 10012_22912 [ #1 ] EDF+ [10012_22912.edf] did not contain any time-track: adding... duration 10.48.52, 38932s | time 19.19.06 - 06.07.58 | date 01.01.01

signals: 27 (of 26) selected in an EDF+C file Patient_Event | EOG_LOC_M2 | EOG_ROC_M1 | EMG_Chin1_Chin2 | EEG_F3_M2 | EEG_F4_M1 | EEG_C3_M2 | EEG_C4_M1 EEG_O1_M2 | EEG_O2_M1 | EEG_CZ_O1 | EMG_LLeg_RLeg | ECG_EKG2_EKG | Snore | Resp_PTAF | Resp_Airflow Resp_Thoracic | Resp_Abdominal | SpO2 | Rate | EtCO2 | Capno | Resp_Rate | C_flow Tidal_Vol | Pressure | EDF Annotations extracting 'EDF Annotations' track from EDF+

annotations: ? (x107) | BED_RAILS_UP (x1) | Blink (x2) | Body_Position_Supine (x1) CBG_STICK (x1) | Close_Eyes (x2) | Deep_Breath (x2) | EEG_arousal (x3) Flex_Left_Leg (x2) | Flex_Right_Leg (x2) | Gain_Filter_Change (x8) | HAND_TO_FACE (x1) HOB_FLAT_FLAT_1_PILLOW_PULSE_OX_RIGHT_INDEX_FINGER (x1) | Hold_Breath (x2) | Impedance_at_10_kOhm (x3) | Look_Down (x2) Look_Left (x2) | Look_Right (x2) | Look_Up (x2) | MOM_GIVING_PATIENT_A_DRINK (x2) Montage_Channel_Test_Referential (x2) | Montage_NCH_PSG_STANDARD (x2) | Montage_NCH_PSG_STANDARD,_Ref (x2) | N1 (x6) N2 (x148) | N3 (x155) | Nasal_Breath (x2) | Open_Eyes (x3) Oral_Breath (x2) | Oxygen_Desaturation (x29) | PATIENT'S_MOM_COUGHING_MAY_BE_AN_OVERCAST_TO_PATIENT (x1) | PATIENT_AROUSED_LOOKING_AROUND (x1) PATIENT_BEING_GIVEN_A_DRINK (x1) | PATIENT_COUGHING (x1) | PATIENT_DRINKING_WATER (x1) | PATIENT_REQUESTING_FOR_SNACKS (x1) PATIENT_WANTED_HER_MOTHER_TO_PROVIDE_HER_WITH_A_DRINK (x1) | PATIENT_WILL_WATCH_TV_TILL_2200_HRS (x1) | RSOL_85 (x1) | Recording_Analyzer_ECG (x1) SOL_61.5 (x1) | SPONTANEOUS_AROUSALS (x1) | Start_Recording (x2) | Started_Analyzer_Data_Trends (x2) Started_Analyzer_ECG (x3) | Started_Analyzer_Sleep_Events (x2) | Stopped_Analyzer_Data_Trends (x1) | Stopped_Analyzer_Sleep_Events (x1) Swallow (x2) | TECH_IN_BATHROOM_IN (x1) | TECH_IN_PATIENT_REQUESTING_ASSISTANCE (x1) | TECH_IN_TO_FIX (x1) TECH_IN_TO_FIX_BELT (x1) | TECH_OUT (x4) | TECH_OUT_BATHROOM_OUT (x1) | TENSION_ON_C3_AND_O1. (x1) THORACIC_AND_ABDOMINAL_BELTS_NOTED._FIXING_SIGNAL (x1) | UNRESOLVED_TECH_BACK_IN (x1) | Video_Recording_ON (x2) | W (x653) chew_gum (x2) | edf_annot (x0) | lights_off (x2) | lights_on (x1) snore (x1)

variables: airflow=Resp_Airfl... | ecg=ECG_EKG2_EKG | eeg=EEG_F3_M2,... | effort=Resp_Thora... emg=EMG_Chin1_... | eog=EOG_LOC_M2... | generic=Patient_Ev... | id=10012_22912 | leg=Rate,Resp_... oxygen=SpO2 | snore=Snore .................................................................. CMD #1: DESC options: sig=* EDF filename : 10012_22912.edf ID : 10012_22912 Header start time : 19.19.06 Last observed time: 06.07.58 Duration : 10:48:52 38932 sec

signals : 26

EDF annotations : 1

Signals : Patient_Event[256] EOG_LOC_M2[256] EOG_ROC_M1[256] EMG_Chin1_Chin2[256] EEG_F3_M2[256] EEG_F4_M1[256] EEG_C3_M2[256] EEG_C4_M1[256] EEG_O1_M2[256] EEG_O2_M1[256] EEG_CZ_O1[256] EMG_LLeg_RLeg[256] ECG_EKG2_EKG[256] Snore[256] Resp_PTAF[256] Resp_Airflow[256] Resp_Thoracic[256] Resp_Abdominal[256] SpO2[256] Rate[256] EtCO2[256] Capno[256] Resp_Rate[256] C_flow[256] Tidal_Vol[256] Pressure[256]


...processed 1 EDFs, done.

...processed 1 command set(s), all of which passed

+++ luna | finishing 09-May-2023 12:41:11 +++

To make for all .tsvs, if using bash you can script a simple loop (obviously changing folder location):

for f in ls /data/nsrr/datasets/nchsdb/sleep_data/*.tsv | xargs -n 1 basename do echo "$f" fannot=echo $f | sed 's/\.tsv/\.annot/g' awk -F"\t" ' NR != 1 { print $3 , $1 , "+"$2 } ' OFS="\t" /data/nsrr/datasets/nchsdb/sleep_data/${f} | tr ':' '_' > ${fannot} done

Alternatively, we can upload all these new .annot files to sleepdata.org, if you look back in a day or so.

Cheers, --Shaun
Hi

Pls check out the Luna documentation, specifically this and the tutorials

In general, you need to specify the EDF and any associated annotation files together (i.e. even if the analysis only happens to use data from the annotation file). The handful of commands such as "--xml" are special cases.

Assuming you're using the most recent version of Luna:

1) Create a 'sample list', e.g. assuming I've downloaded the data in /data/nsrr/datasets/

luna --build /data/nsrr/datasets/shhs/polysomnography/edfs/ /data/nsrr/datasets/shhs/polysomnography/annotations-events-nsrr/ -ext=-nsrr.xml > s.lst

Each row will be 3 tab-delimited columns (note, lines may wrap in this browser view), which matches up the EDF and the XMLs (i.e. ~5000 rows to this file, the first of which will look like this:)

shhs1-200001 /data/nsrr/datasets/shhs/polysomnography/edfs/shhs1/shhs1-200001.edf /data/nsrr/datasets/shhs/polysomnography/annotations-events-nsrr/shhs1/shhs1-200001-nsrr.xml

2) Run STAGES command using that sample list

luna s.lst 1 5 -t o1 -s STAGE

e.g. here just for first five people, sending output to a folder "o1"

3) Confirm output:

$ ls o1/

shhs1-200001 shhs1-200002 shhs1-200003 shhs1-200004 shhs1-200005

$ head o1/shhs1-200001/STAGE-E.txt

ID E CLOCK_TIME MINS STAGE STAGE_N

shhs1-200001 1 22.00.00 0 wake 1

shhs1-200001 2 22.00.30 0.5 wake 1

shhs1-200001 3 22.01.00 1 wake 1

etc

4) To run for all people, remove the "1 5" from the command line. To dump to a database instead of text, use "-o" etc, etc. as described in the Luna Docs. The output are tab-delimited, you can easily extract fifth column and concatenate across samples, etc, as desired.