Dear colleagues,
I am a sleep researcher specializing in polysomnography analysis. Currently, I am conducting research on the application of Fourier analysis to EEG signals, specifically focusing on the SHHS dataset.
During my analysis, I observed high energy peaks at 50 Hz in the EEG signals. This finding puzzled me, as the SHHS sleep data were collected in North America, where powerline artifacts typically occur at 60 Hz. Despite my efforts to gather information from previous articles, I have found limited literature addressing this particular issue.
I would greatly appreciate any insights or knowledge regarding the origins or explanations behind these observed peaks. Any assistance will be immensely appreciated.
Sincerely,
Jesse Lo
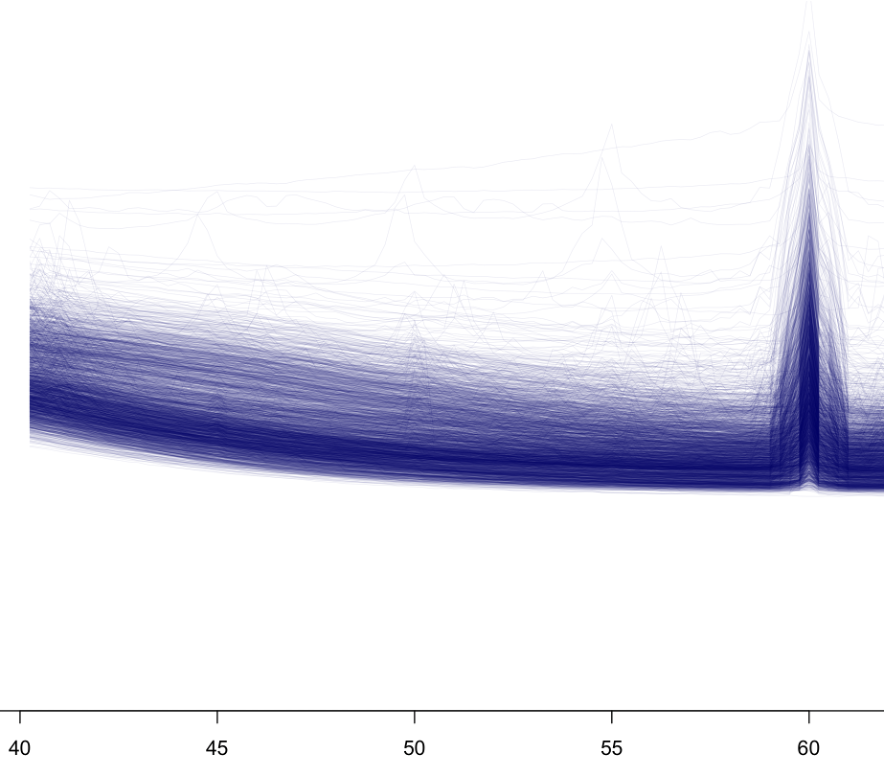
Hi -- I wasn't involved w/ the SHHS data collection, so I can't really speak to the hardware specifics, recording set-ups, etc, with any authority. However, taking a cursory look at the SHHS EEG power spectra, I can comment that the predominant peak is at 60 Hz (i.e. as expected for mains hum in the US), not 50 Hz. i.e. here are all spectra for C4-M1 from ~2500 individuals in SHHS2 super-imposed:
Certainly, on closer inspection some individuals will inevitably exhibit other forms of artifact, but 50 Hz line noise doesn't appear to be a primary form for this channel. For example, looking at the mean power from n~5000 individuals SHHS1 for the same channel - here plotting the mean doesn't show any marked sample-level peak at 50 Hz (perhaps a tiny blip...), but it does show a clear peak at 60 Hz (left panel).
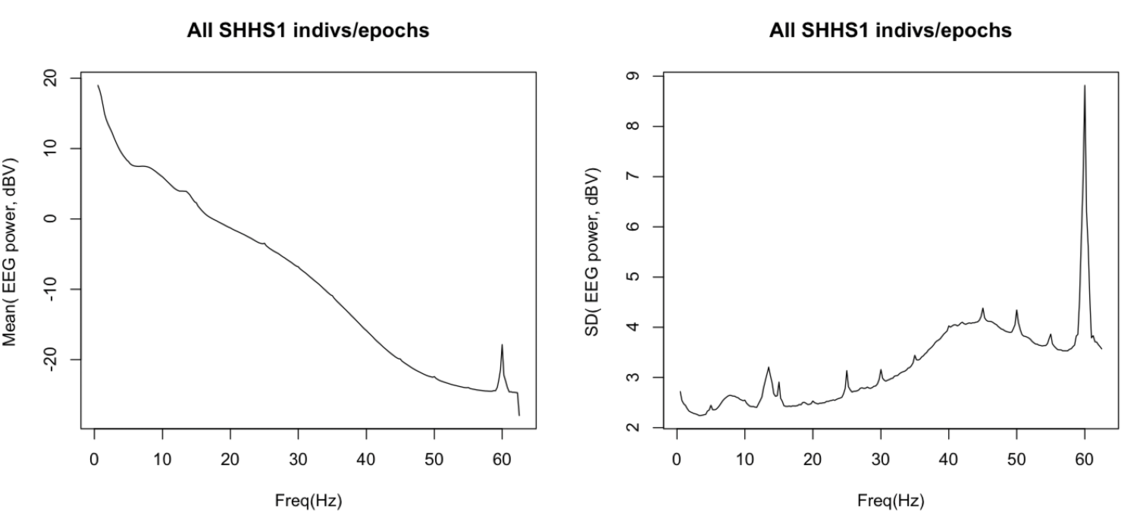
If one instead looks at the standard deviation of power across individuals (rather than the mean), there is some suggestion of increased inter-individuals differences in 50 Hz power, suggesting that a subset of individuals may show excess 50 Hz noise -- but (as expected) the variability in 60 Hz power is much greater; there are also other frequencies in the raw, un-QC'ed signal showing similar things, e.g. subharmonics at 25, 30, 55 Hz, etc). Presumably in some recordings there were other electrical devices operating at these frequencies/harmonics of.... I don't imagine that resolving exactly what those sources would be feasible/necessary. In any case, the main point is that we seem to see the expected 60 Hz noise, not 50 Hz. Let us know if you have other specific analyses that point to 50 Hz noise as predominant.
Cheers, --Shaun
Thank you for your prompt response. I concur with your assessment. Upon reviewing the analysis I conducted, I have come to realize that my initial perception of 50 Hz as the primary artifact frequency was based on certain spectrograms I had plotted, revealing significant amplitude over 50 Hz. However, upon further examination of Fourier plots, it has become evident that the predominant noise indeed lies at 60 Hz. I sincerely appreciate your valuable input.
Sincerely,
Jesse Lo