Sleep Heart Health Study
6.6.2.5 Episodic events in sleep
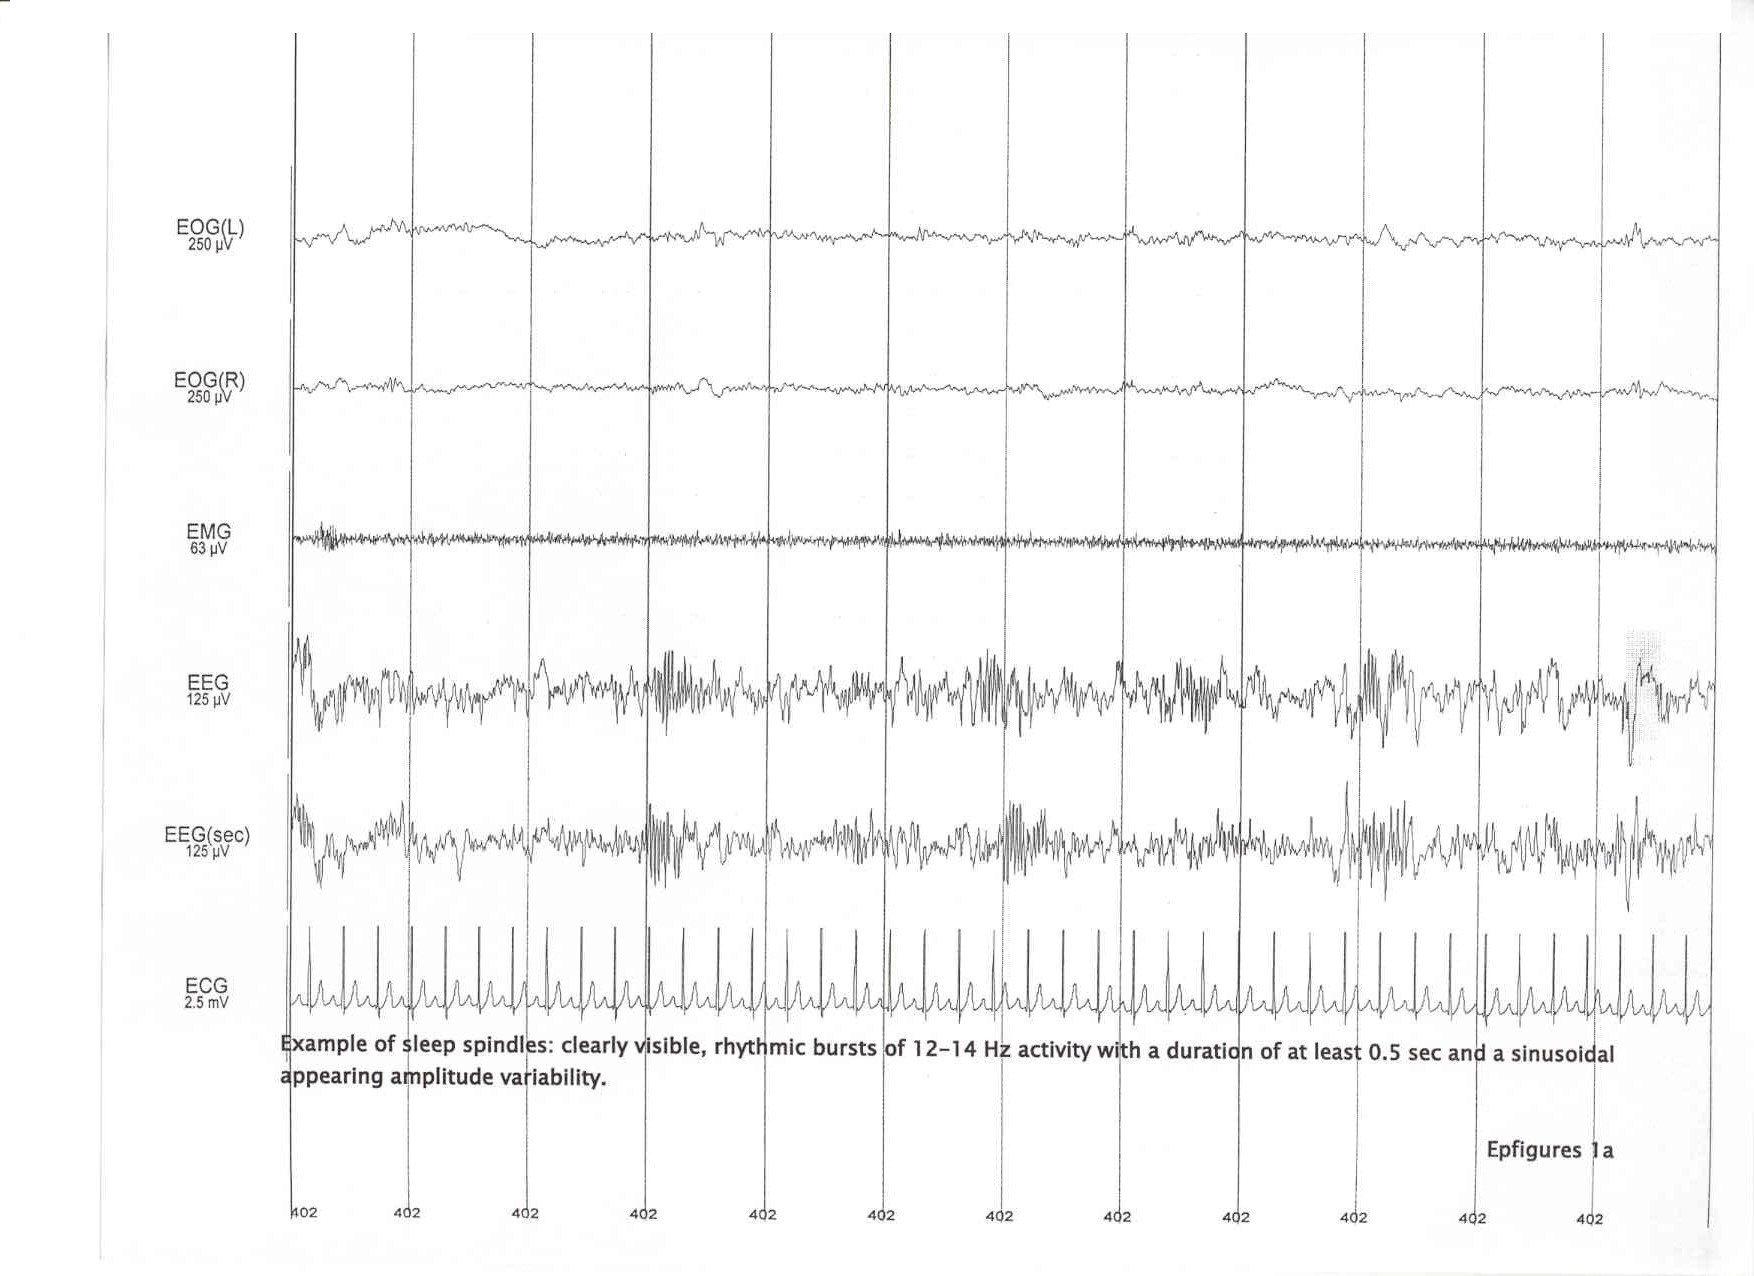
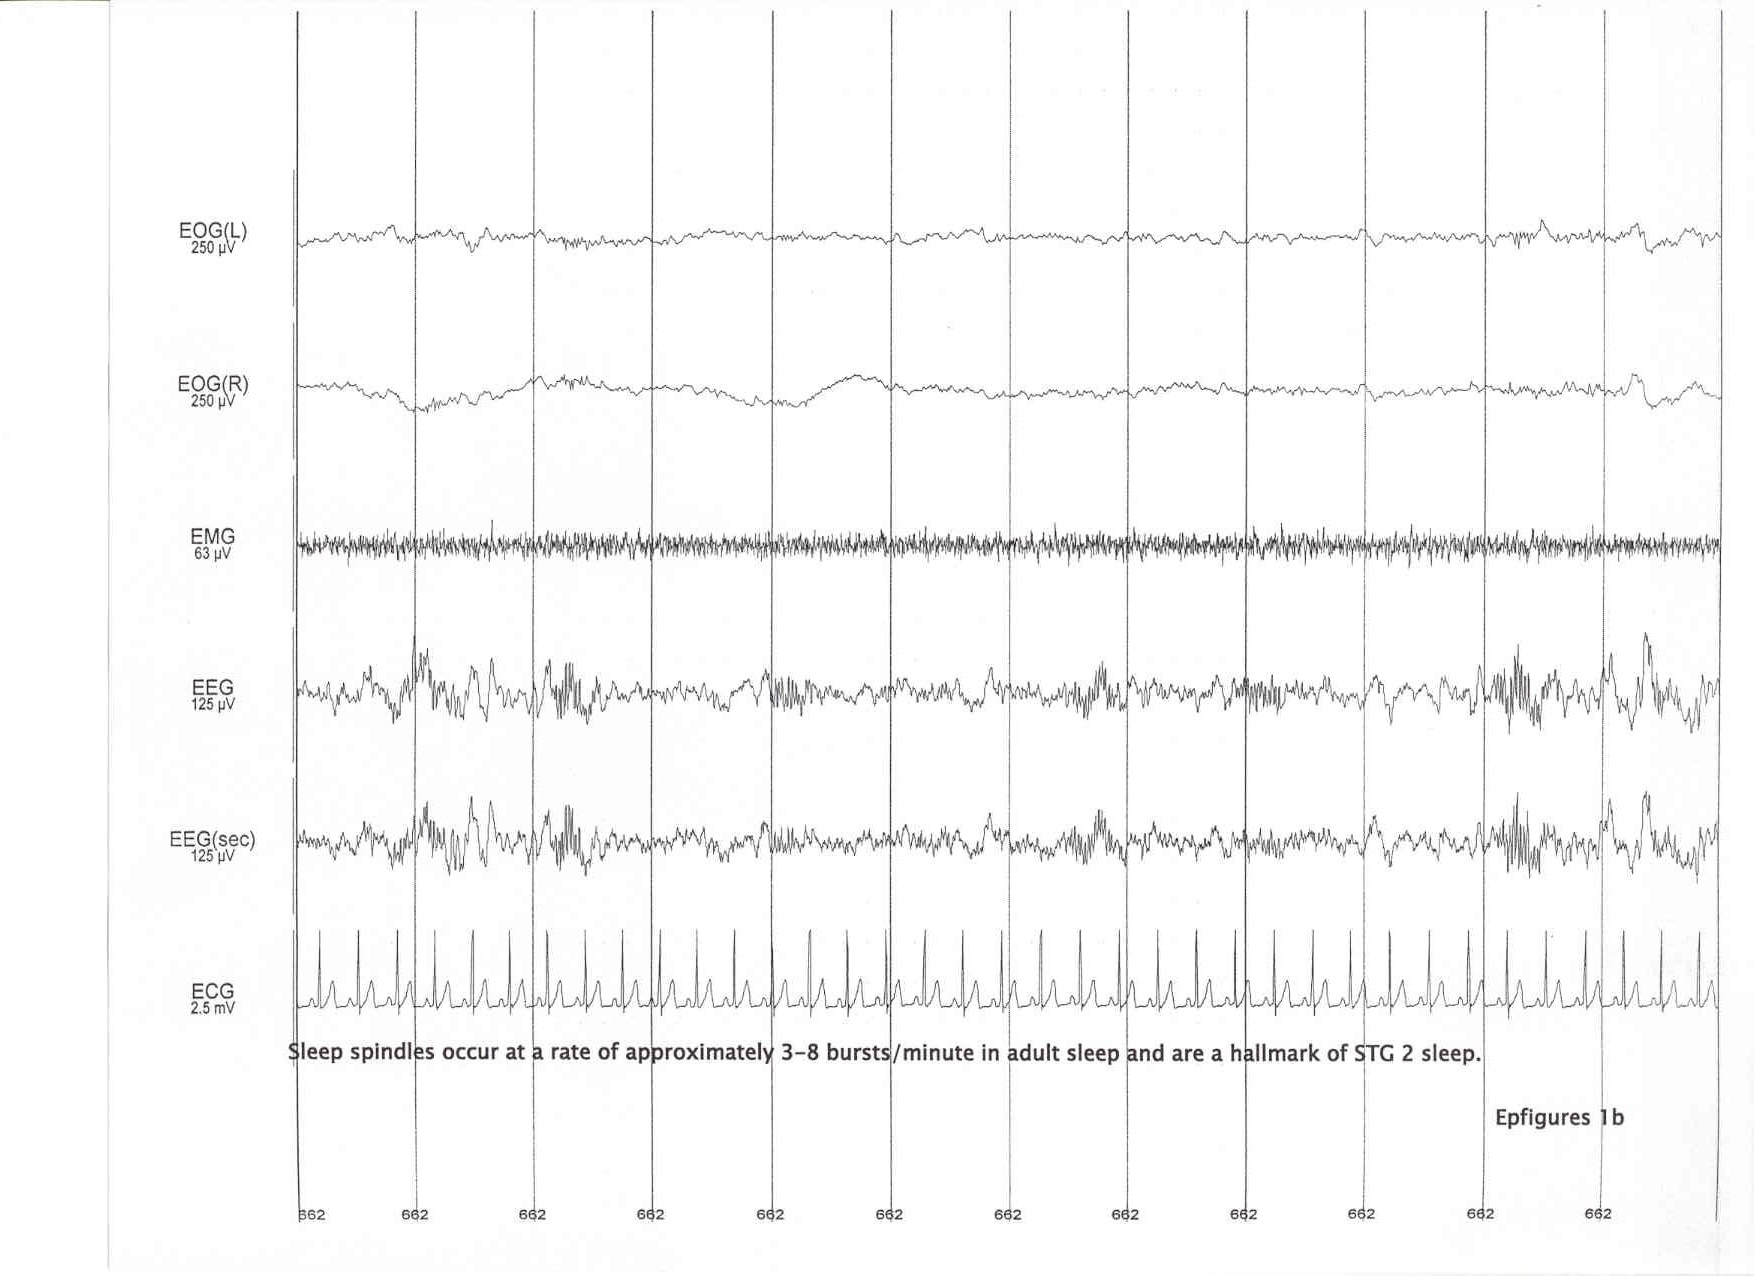
Sleep spindles: clearly visible, rhythmic bursts of activity 12-14 Hz, duration at least 0.5 s. (one should be able to count 6 or 7 distinctive waves within a half-second period); the amplitude variability appears sinusoidal. (EpFigures 1a and 1b)
Sleep spindle activity occurs in adults with a frequency of about three to eight bursts per minute in Stage 2 sleep. These are absent in wakefulness and Stage 1. Spindles may be rarely observed in Stage REM and 3-4. Spindle rate appears to be a fairly stable individual characteristic. In the elderly and in individuals with various medical conditions, sleep spindles tend to lose their classic morphology and may have a slightly slower frequency, lower amplitude, and shorter duration.
Medication effects can introduce beta range activity that may be confused with spindles. Tips to alert to the presence of drug effects mimicking spindles are two or more of the following: (EpFigures 2a and 2b)
- Increased beta activity (spindle like) in well defined REM sleep and wakefulness.
- Increased spindle duration (often > 1 sec.)
- Increased frequency of spindles per epoch (>5/epoch).
- Spindle like activity with amplitude variability that is NOT sinusoidal.
- Fast frequencies (often > 13 Hz).
- When identifying atypical “spindle activity,” review previous epochs to ascertain if stage was properly scored.
- When atypical spindle like activity is observed, then such activity cannot be used to distinguish Stage 2 from other sleep stages. This may lead to some underscoring of Stage 2 from 1.
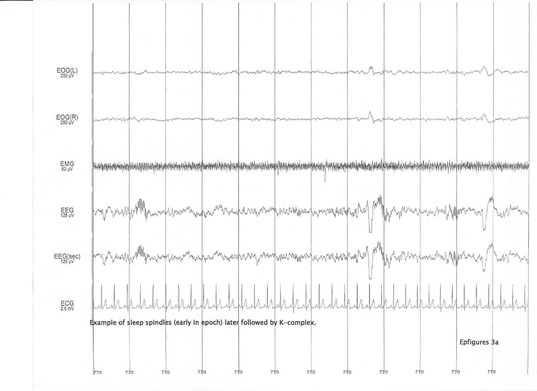
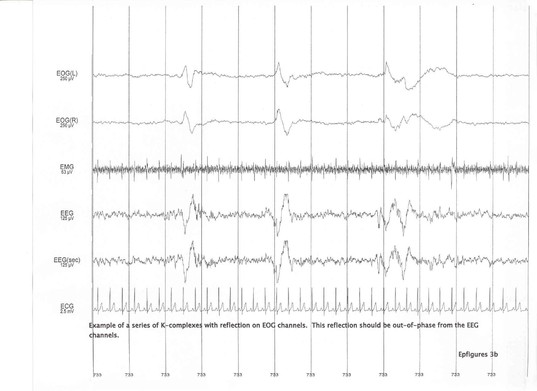
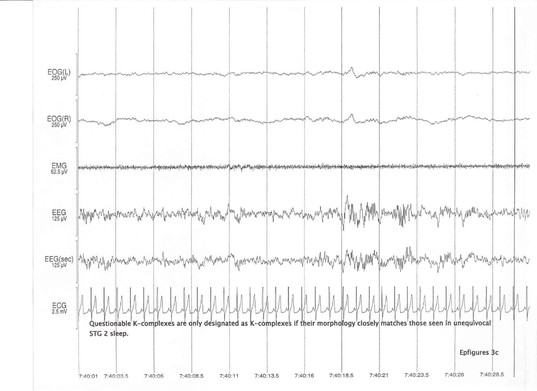
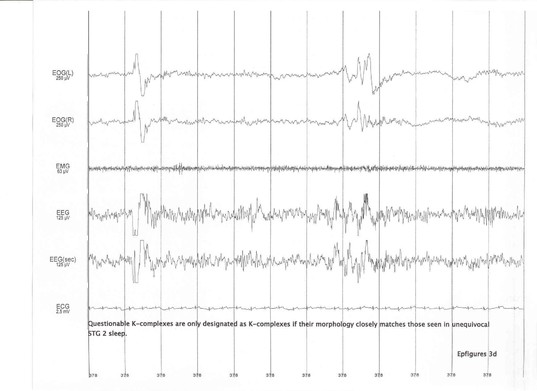
K-complex: EEG waveforms having a well-outlined negative sharp wave, immediately followed by a positive component. Total duration of the K complex should exceed 0.5 s. Waves of 12-14 Hz (sleep spindles) may or may not constitute part of K complex. K complexes can occur as a response to sudden auditory stimuli. K complexes may be reflected on the EOG channels. When in doubt about whether a particular polyphasic wave is a “true” K complex, record is scanned for clear Stage 2 sleep. Questionable K complexes are only designated as K complexes if their morphology closely matches those seen in unequivocal Stage 2 sleep. (EpFigures 3a, 3b, 3c, and 3d)
Caution! On the Compumedics system used in SHHS 1, with correct electrode placements, the first, negative part of K complex should be down going and subsequent positive component up (as seen with some traditional polygraphs). If the K complex is reflected on the EOG channels, it will usually appear to be in the opposite phase as that seen on the EEG channel. Sometimes K complexes on EEG are in the same phase as on EOG channels (EEG tracing is upside down). This may be caused by erroneous electrode placement (switching the reference with the C3 or C 4 electrode). If this happens on the channel used for scoring sleep stages, the computer will not recognize K complexes during automatic analysis.
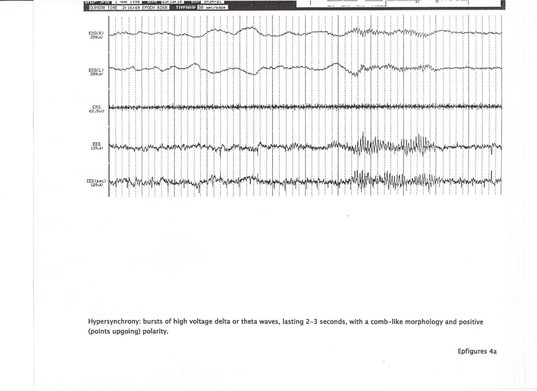
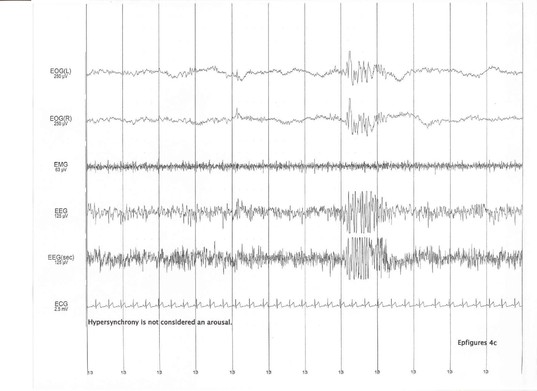
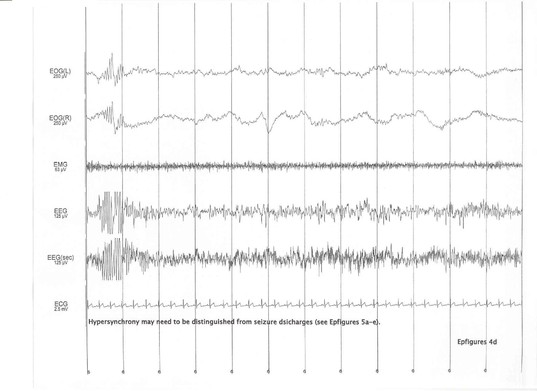
Hypersynchrony: bursts of high voltage delta (< 4 Hz) or theta (4 - 7 Hz) waves lasting 2-3 s. with a comb-like morphology with a positive polarity (points up going). Hypersynchrony is not considered an arousal. May need to be distinguished from seizure discharges. (EpFigures 4a, 4b, 4c, and 4d) In children, this actually may be exaggerated. It is relatively more common during the transition from wakefulness to sleep.
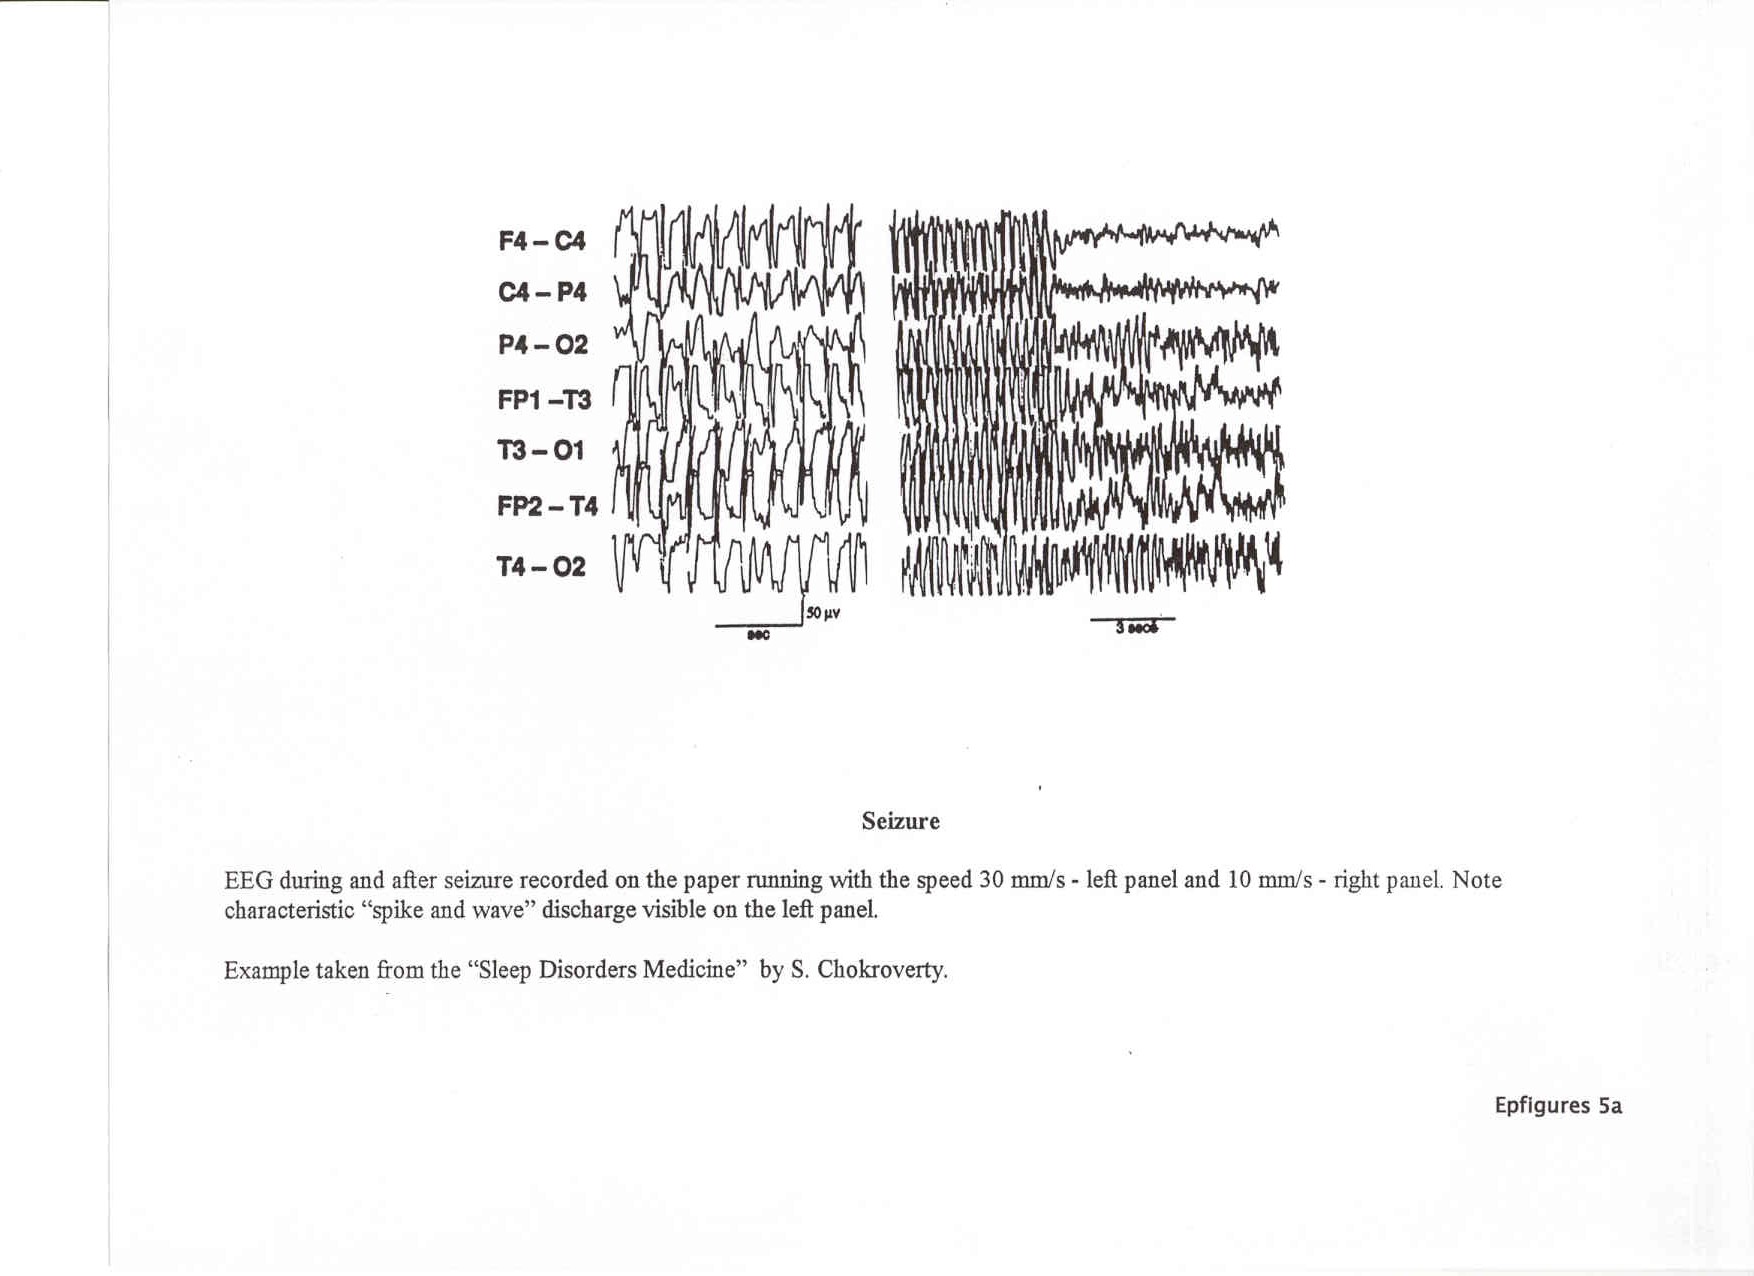
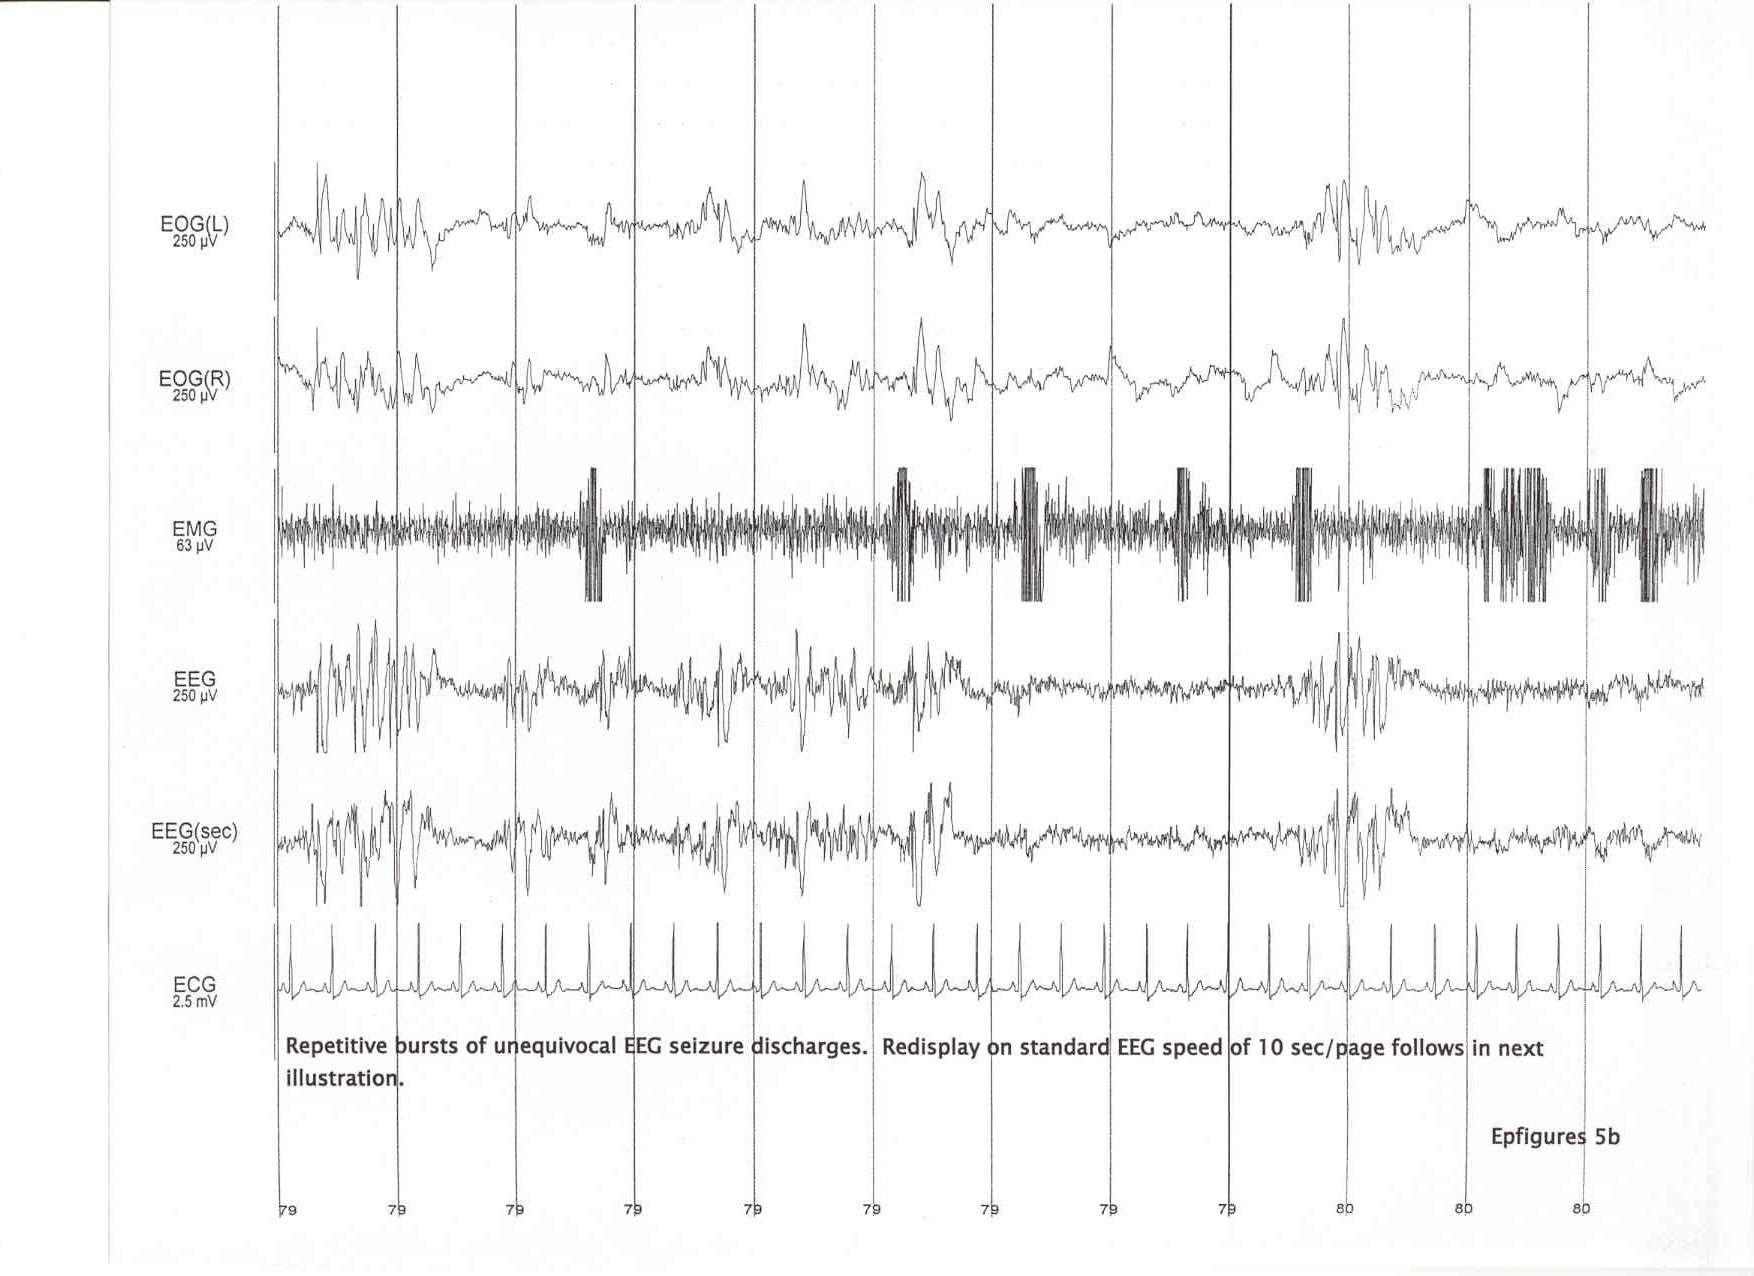
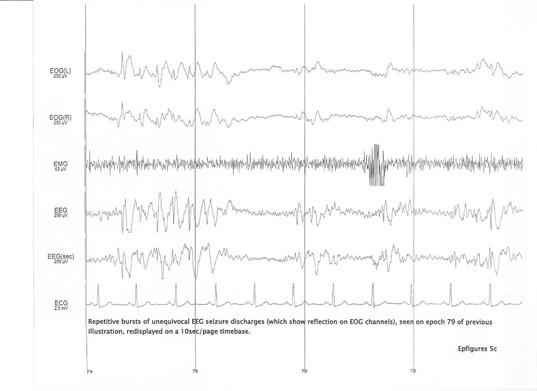
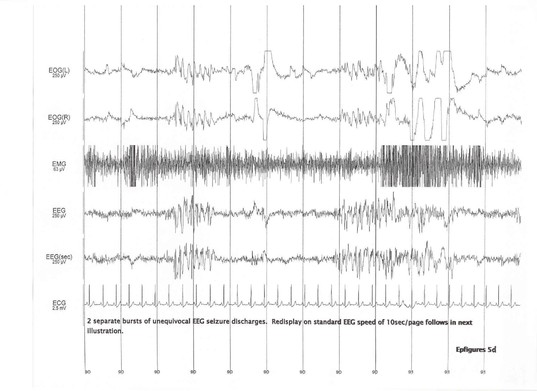
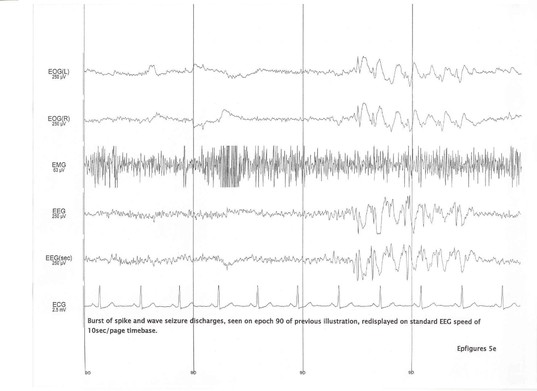
Seizures: This is manifest by an abrupt change in background EEG. This usually requires a wider sampling of areas of the brain than is provided with our montage. Two patterns are commonly seen: 1) High voltage, rhythmic activity in the 2-6 Hz range, or 2) Diffuse sustained beta activity. A seizure is often accompanied by prominent muscle artifact. A seizure is usually followed by low to moderate voltage irregular slowing. On the 10 s. screen, characteristic ‘spikes and wave’ pattern may be seen. If a possible seizure is identified, a physician investigator will be immediately asked to review the study. (EpFigures 5a, 5b, 5c, 5d, and 5e)
