Childhood Adenotonsillectomy Trial
3.2 Condensed Data Dictionary
A Condensed PSG Data Dictionary (DD) is available to all users. It contains commonly calculated PSG variables derived from the raw PSG variables, as well as a few commonly used raw PSG variables. A full PSG Data Dictionary containing all raw variables is available at the Sleep Reading Center if requested.
The User can use this DD (provided initially as an excel spreadsheet) to search by variable name (name), broad data type (domain), data label, etc. In addition, the DD identifies the forms used to capture the data, a brief description of the data, restrictions placed on derived data (e.g., stage variables were not generated if the EEG was too poor to allow reliable staging), the computation derivation of the derived variables, and units the variable is expressed.
3.2.1 Acquisition Variables
Use to identify: Site, collection units; capnograph or oximeter types, baseline or follow-up study. Data provided by sites on collection forms. Detailed information regarding equipment used at each site, standardized recording montage setting, sensors and specific signal collection issues relating to EDF can be found in the Data Acquisition section.
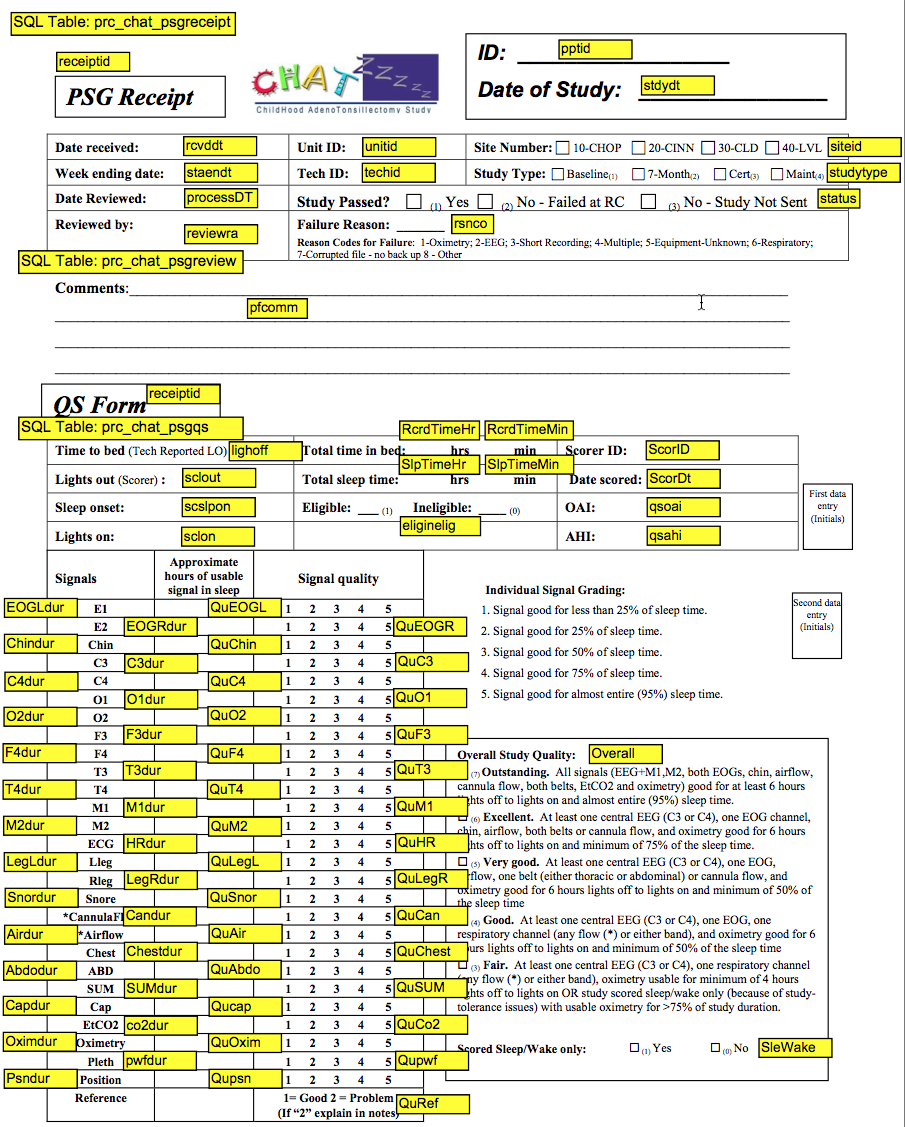
3.2.2 Quality Codes – Scoring Variables (see QS Form with variable names and quality codes defined)
Quality Codes provide information on which studies may contribute data of different quality for specific analyses, acknowledging that not all studies will provide “reliable” data for all measures due to loss of signals or equipment problems.
“Overall” indicates the overall study quality, varying from “outstanding” (code=7) to “fair” (code=3). This code reflects the total duration of useable (artifact free, scorable) signals across channels, weighing those signals most critical for accurate hypopnea detection and staging.
Signal Quality grades are also assigned to each channel. These vary from 1 (poorest) to 5 (best) and reflect the proportion of the sleep period that the signals were “useable.”
Useable respiratory data is defined as the number or of hours that abnormal breaths can be distinguished from “normal” breaths; EEG/EOG/EMG data are defined by the number of hours that sleep stages can be distinguished from awake. Hours of useable signal are rounded out to the lowest whole integer (e.g. 4.6 hours of useable data = 4).
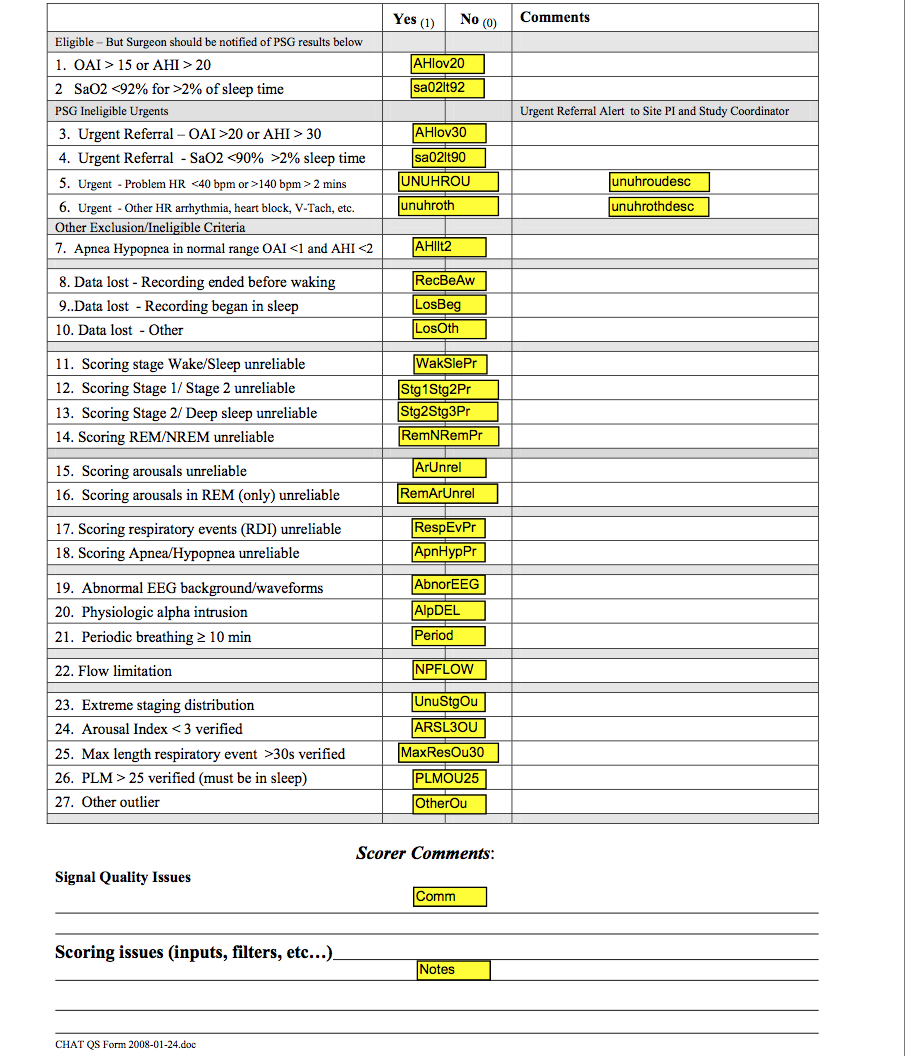
3.2.3 QS Form Codebook
3.2.4 Hard Filters
Hard Filters are used to identify problem studies and/or fields where it is invalid to provide a raw or derived variable because of missing signal or very poor quality signal data. Listed below are descriptions of when data were eliminated from the data set due to an inability to generate specific metrics as well as suggestions on how quality codes can be applied to obtain different degrees of signal reliability relevant to specific analysis.
- All staging and arousal index will be missing when the EEG is insufficient in quality to allow distinction of stages. This will be flagged by the code slewake=1. Studies scored as “sleep wake” have all sleep stages scored using a default of “Stage 2” and no arousals are scored. This impacts 2 studies which were scored as “sleep wake”: 201047_081408 and 301041_112108 (both ineligible).
- Due to oximetry EDF conversion issues with Biologic equipment (approximately 1.5% lower readings after import into Compumedics Profusion software), a review of oximetry values recorded at the site was done for 501009_081309 where this difference affected eligibility. Study was determined to be eligible based on site oximetry summary. Two other Biologic studies: 701037_121809 and 701102_102810 (both ineligible) had questionable oximetry relating to equipment calibration issues. None of these studies could be repeated. Oximetry data for these three studies has been removed.
- Status indicates whether the study passed quality (=1) or failed (= 2). As of Oct 2011, this code identified 2 failed studies: 401001_102907 (7 weeks out of window) and 701056_032510 (Clinical study – Masimo Oximetry used could not be converted) - all data removed.
- If time in REM = 0 all calculations based on REM sleep time will be missing.
- If quality grade for Position is coded as “1” (QuPos=1) then position data is not available or is unreliable so data will be missing for variables based on Supine and Non-Supine calculations.
- EtCO2 data will be missing for all studies with QuCap coded as “1”. The quality code of “1” identifies studies with no data collected or unreliable data due to incomplete calibration of the equipment or problems with the cannula/airflow signal.
- If lights off = sleep onset indicating ppt asleep at start of recording, then sleep latency (slp_lat) will be missing.
3.2.5 Soft Filters That Can Be Applied
Refer to DD for full description of each code.
The DD provides suggested codes that can be applied to each variable to help identify subsets of data which may be most reliable for selective analyses. The following examples show how such filters can be applied. Please refer to the QC code sheet for specific code values and names.
Potential Use #1
Identify studies where sleep latency or sleep duration measures are of interest
RecBeAw = 0LosBeg = 0LosOth = 0
These variables identify studies where ppt asleep before recording began, study ended in sleep, or signal loss shortened time of sleep period. A “0” code indicates full night of sleep captured.
Potential Use #2
Identify studies where sleep stages are most reliably scored
WakSlePr = 0(sleep-wake transitions)Stg1Stg2Pr = 0(stage1-2 transitions)Stg2Stg3Pr = 0(stage2-3 transitions)RemNRemPr = 0(stage rem-nrem transitions)
These variables identify studies where the scorer felt that underlying signals made accurate distinction for specific sleep transitions suboptimal. Note that these studies were staged and the staging data may be used although it is possible there is some misclassification.
Potential Use #3
Identify studies where arousals are most reliably scored
ArUnrel = 0RemArUnrel = 0
ArUnrel identifies studies where underlying artifact of background EEG made distinguishing arousals difficult.
RemArUnrel identifies studies where EMG signal problems made scoring arousals in REM difficult.
These restricting filters can also be used for RDI/AHI variables that count events linked to arousals.
Potential Use #4
Identify studies where distinguishing respiratory event subtypes is of greatest reliability
QuAir = 3, 4, 5QuCan = 3, 4, 5QuAbdo = 3, 4, 5QuChest = 3, 4, 5RespEvPr = 0ApnHypPr = 0
The “Qu-“ grades use a scale of 1 to 5 which are applied to each signal to grade the proportion of sleep time that the signal was easily scorable and mostly artifact free. Signals with grades 1 or 2 mean that the signal was of poor quality for as much as 50% of the sleep period. Since apneas require a good thermistry signal, the QuAir =1 or =2 identifies studies where apnea vs hypopnea distinction is unreliable. Since central apneas require visualization of effort on two bands, the QuAbdo and QuChest =1 or =2 identifies studies where central events may be poorly distinguished from obstructives.
RespEvPr and ApnHypPr also provide information on the overall ability of the scorer to detect respiratory events and to distinguish Apnea vs Hypopnea events, respectively.
Potential Use #5
Interest in reliable oxygen saturation
QuOxi 4-5(1645 studies)QuOxi 3(6 studies)QuOxi 1(3 studies)
QuOxivalues of 1 or 2 identifies oximetry data that were poor for as much as 50% of sleep time. 3 studies with values of 1 have been identified in the notes and oximetry data has been removed.
Potential Use #6
Interest in positional dependency
Qupsn 4-5(1305 studies)Qupsn 2-3( 204 studies)Qupsn 1( 145 studies)
None of the position sensors used converted through EDF. Supine position hand scored from technician notes or from numerical display validated with calibrated notes from technician. If notes missing or numerical display appeared unreliable or could not be validated a low quality score of “1” was given and position data will be missing. Studies collected with Compumedics equipment have normal position data but could have been scored by tech notes if sensor not working or calibrated properly. Position quality of 4 or 5 indicate position sensor from Compumedics used or supine scored/entered from numerical calibrated data. Quality grade of 2 or 3 indicates position data entered from tech notes.
Potential Use #7
Interest in end-tidal CO2
Identification of capnograph used
QuCap 4-5(1219 studies)QuCap 3( 61 studies)QuCap 2( 26 studies)QuCap 1( 348 studies)Capnotype 1 NovametrixCapnotype 2 BCI
Valid CO2 data depended on a properly calibrated Cap signal with numeric display in order for scoring software to calculate and generate useable data. Studies using Biologic equipment (Site 70 and some Site 50 studies) have no useable CO2 data due to equipment limitations on collecting this calibrated signal properly.
CO2 data may also depend on sensor used. Novametrix sensors were used for n=1082 studies and BCI for n=198 studies. Most studies used the same sensor for the baseline and post-Rx study, however, there are a few exceptions. A substudy of 19 children studied with both sensors was performed that showed 2 to 4% systematic higher values for the Novametrix sensor. Using these data, a calibration curve was fit for each CO2 reading, adjusting BCI readings for this corrections. (See below) Suggest that for cross sectional analyses, the Nova_est_co2 variables be used (reflecting original Novametrix values when available and BCI values adjusted for the difference in the sensors). For pre-post comparisons, suggest use the original CO2 data for all analyses where the same sensor (capnotype) was used for both studies (use the rCO2 values). For those studies where the capnograph changes (capnography = 1 on more study and = 2 on the other), used the Nova_adjusted values.
- For BCI:
Nova_est_CO2PEAK = (rco2peak * 0.79956) + 9.17655 - For BCI:
Nova_est_CO2BLWAKE = (rco2blwake * 0.65305) + 13.40939 - For BCI:
Nova_est_CO2BLSLP = (rco2blslp * 0.51229) + 20.03075 - For BCI:
Nova_est_CO2AVGR = (rco2avgr * 0.70253) + 10.67195 - For BCI:
Nova_est_CO2AVGNR = (rco2avgnr * 0.49613) + 20.83379 - For BCI:
Nova_est_PCTCO2G45 = (rpctco2g45 * 0.64525) + 7.67373 - For BCI:
Nova_est_PCTCO2G50 = (rpctco2g50 * 0.42979) + 0.64553

