Greetings,
I hope this is not considered frivolous . Does anyone have any experience using a treemapping software such as was developed at the University of Maryland Department of Computer Science with the data contained here?
I wonder if the data would lend itself to data visualization as it with other data sets. I attended a presentation recently on data visualization and found that it can be a powerful way to present large amount of data in a meaningful way, particularly to the untrained observer.
Thank you,
Edward Grandi
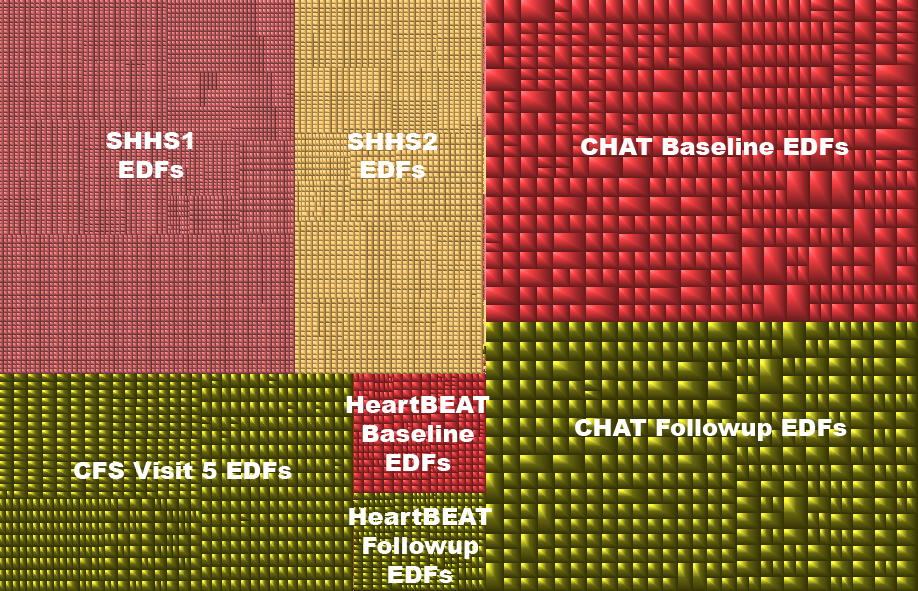
Hi Edward, I'm not sure if this is quite what you meant, but I went ahead and generated a treemap of the files hosted on the NSRR website. While the large sections of each dataset are primarily taken up by EDFs, they also include EDF annotations (XML), covariate datasets (CSVs), and Code Book CRFs (PDFs).
Also interesting to note is that the CHAT EDFs are much larger than other EDFs, since they contain many more signal channels for each EDF.
We may make a web version of this in the future, as it's a great way of exploring the datasets. I haven't found a good web-based treemap tool yet, although Google Charts appears to have a rudimentary one available.
Hi Remo, thank you for the reply and the interest. If I may, let me provide a link to the University of Maryland site that has a very popular (and free) program for treemapping - http://www.cs.umd.edu/hcil/ - I heard a presentation last week at the National Academy of Sciences from one of the professors who developed the software. He indicated that all that the program can work with CSV datasets. I thought to experiment with those files, but waiting to see if I get the IRB approval. You will likely be able to tell me if what I want to do is possible.
Hi Edward,
I scanned Ben Shneiderman's recent work since I haven't worked with tree maps much. I believe you are on to a potentially rich research area. You might want to consider focusing on creating visualizations related to issues associated with the signal processing pipeline. (1) There are currently no good ways to look at the annotation files which are written in an XML format. Being able to access and view the contents could be the start of many research directions. (2) Viewing the signal specifications of a large cohort to look for inconsistencies. We are also beginning some large scale analyses that would benefit for post analysis visualization. I would be happy to discuss the type of analyses that we are doing, if you are interested in post processing/analysis visualizations. Although the visualization could be done from a CSV, I would encourage you to consider working from raw files; possibly with a schema/search driven search component. Accessing and organizing raw sleep output is still some what of a challenge for novice to intermediate programmers.
Best, Dennis
P.S. Ben Shneiderman is one of my CS idols.
Hi Robert, The NSRR Review Committee should be meeting again soon and will review a number of recently submitted DAUAs. You'll be notified if your DAUA is approved or sent back for resubmission. Once it's approved, you'll be able to download the CSV datasets listed under the downloads folder for each dataset. Good luck with the computation!
Hi Dennis,
Thanks for your comment. Listening to Ben speak last week was great and he lead a tour of 12 visualizations he put together using various data sets. You can see them on the CS website listed above. Once I get access to the data here I will play around with it. It may well be beyond my capability, but I will try.
All the best,
Ed
P.S. I will reach out to you offline.